
2018年8月18日雅思大作文机经预测:话题14
参考题目14
Write a report for a university lecturer describing the information in the two graphs below. You should write at least 150 words. ...
Write a report for a university lecturer describing the information in the two graphs below. You should write at least 150 words. Allow yourself 20 minutes for this task.
图片
解题思路
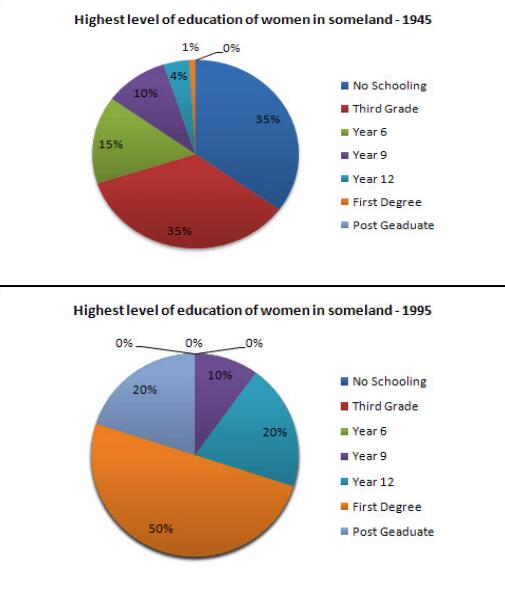
【首段】总述1945年和1995年某地女性教育程度,后者高于前者 【二段】分述对比1945年和1995年各个教育程度的女性比例 【尾段】总述教育程度更高了
范文
The pie charts compare the highest level of education achieved by women in Someland across two years, 1945 and 1995. It can be clearly seen that women received a much higher level of education in Someland in 1995 than they did in 1945. In 1945 only 30% of women completed their secondary education and 1% went on to a first degree. No women had completed post-graduate studies. This situation had changed radically by 1995. In 1995, 90% of women in Someland had completed secondary education and of those, half had graduated from an initial degree and 20% had gone on to postgraduate studies. At the other end of the scale we can see that by 1995 all girls were completing lower secondary, although 10% ended their schooling at this point. This is in stark contrast with 1945 when only 30% of girls completed primary school, 35% had no schooling at all and 35% only completed the third grade. In conclusion, we can see that in the 50 years from 1945 to 1995 there have been huge positive developments to the education levels of women in Someland.
- 03-27·2019年4月6日雅思写作小范围机经预测
- 03-25·2019年4月27日雅思写作机经预测
- 03-20·2019年4月25日雅思写作机经题目预测及范文
- 03-19·2019年4月13日雅思写作机经预测
- 03-18·2019年4月6日雅思写作小范围预测
- 12019-02-262019年3月9日雅思写作小范围预测
- 22019-02-122019年2月16日雅思写作机经预测
- 32019-01-262019年1月26日雅思写作小范围预测
- 42019-01-172019年1月19日雅思写作大范围预测
- 52019-01-172019年1月19日雅思写作小范围预测
编辑推荐
book.examw.com
-
 雅思9分之“听”为上策--新航道英语学习丛书¥39.00


- 模拟试题
- 历年真题