
2018年8月18日雅思大作文机经预测:话题9
参考题目9
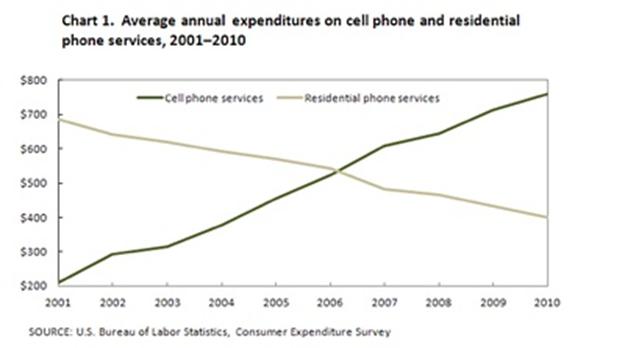
The line graph compares average yearly spending by Americans on mobile and landline phone services from 2001 to 2010.
图片
解题思路
【首段】总述图表比较2001年到2010年美国手机费用和固定电话费用的变化 【二段】总述使用手机费用增长固定电话费用减少,在2006年手机费用超过固定电话费用 【三段】分述2001年到2006年手机费用和固定电话费用的变化情况 【尾段】分述2006年到2010年手机费用和固定电话费用的变化情况
范文
The line graph compares average yearly spending by Americans on mobile and landline phone services from 2001 to 2010. It is clear that spending on landline phones fell steadily over the 10-year period, while mobile phone expenditure rose quickly. The year 2006 marks the point at which expenditure on mobile services overtook that for residential phone services. In 2001, US consumers spent an average of nearly $700 on residential phone services, compared to only around $200 on cell phone services. Over the following five years, average yearly spending on landlines dropped by nearly $200. By contrast, expenditure on mobiles rose by approximately $300. In the year 2006, the average American paid out the same amount of money on both types of phone service, spending just over $500 on each. By 2010, expenditure on mobile phones had reached around $750, while the figure for spending on residential services had fallen to just over half this amount.
- 03-27·2019年4月6日雅思写作小范围机经预测
- 03-25·2019年4月27日雅思写作机经预测
- 03-20·2019年4月25日雅思写作机经题目预测及范文
- 03-19·2019年4月13日雅思写作机经预测
- 03-18·2019年4月6日雅思写作小范围预测
- 12019-02-262019年3月9日雅思写作小范围预测
- 22019-02-122019年2月16日雅思写作机经预测
- 32019-01-262019年1月26日雅思写作小范围预测
- 42019-01-172019年1月19日雅思写作大范围预测
- 52019-01-172019年1月19日雅思写作小范围预测
编辑推荐
book.examw.com
-
 雅思9分之“听”为上策--新航道英语学习丛书¥39.00


- 模拟试题
- 历年真题