
2018年6月2日雅思写作机经小作文二
参考题目2
You should spend about 20 minutes on this task. Write a report for a university lecturer describing the information shown below. Y...
You should spend about 20 minutes on this task. Write a report for a university lecturer describing the information shown below. You should write at least 150 words.
图片
解题思路
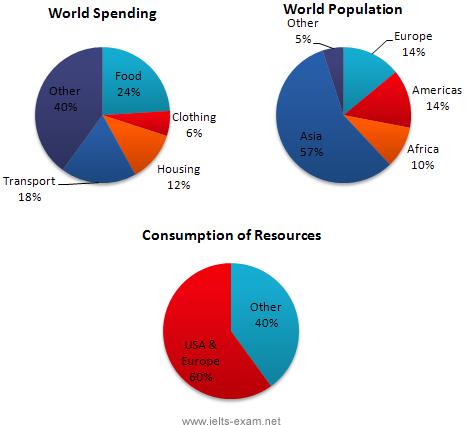
【首段】总述三个饼图的名称 【二段】分述世界支出在各个项目上的比例 【三段】分述各洲占世界人口的比例 【四段】分述各洲消耗资源的比例 【尾段】总述三图比例最大者
范文
In this analysis we will examine three pie charts. The first one is headed ‘World Spending.’ The second is ‘World Population’ and the third is ‘Consumption of Resources.’ In the first chart we can see that people spend most of their income (24%) on food. In some countries this percentage would obviously be much higher. Transport and then housing are the next major expenses at 18% and 12% respectively. Only 6% of income is spent on clothing. In the second chart entitled ‘World Population’, it is not surprising to find that 57% of people live in Asia. In fact China and India are two of the most populated countries in the world and they are both situated on this continent. Europe and the Americans account for nearly 30% of the total, whilst 10% of people live in Africa. Finally, the third chart reveals that the USA and Europe consume a huge 60% of the world’s resource. To sum up, the major expenditure is on food, the population figures are the highest for Asia and the major consumers are the USA and Europe.
- 03-27·2019年4月6日雅思写作小范围机经预测
- 03-25·2019年4月27日雅思写作机经预测
- 03-20·2019年4月25日雅思写作机经题目预测及范文
- 03-19·2019年4月13日雅思写作机经预测
- 03-18·2019年4月6日雅思写作小范围预测
- 12019-02-262019年3月9日雅思写作小范围预测
- 22019-02-122019年2月16日雅思写作机经预测
- 32019-01-262019年1月26日雅思写作小范围预测
- 42019-01-172019年1月19日雅思写作大范围预测
- 52019-01-172019年1月19日雅思写作小范围预测
编辑推荐
book.examw.com
-
 雅思9分之“听”为上策--新航道英语学习丛书¥39.00


- 模拟试题
- 历年真题