
2018年6月2日雅思写作机经重点预测小作文(5)
参考题目5
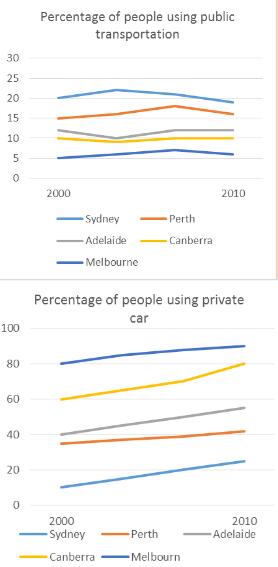
The line graphs show the percentage of people using public transport and people using private cars in five cities of Australia fro...
The line graphs show the percentage of people using public transport and people using private cars in five cities of Australia from 2000 to 2010.
图片
解题思路
【首段】总述图表显示2000年到2010年澳大利亚五个城市使用公交和私人轿车的比例变化 【二段】分述公交在五个城市使用比例的变化 【三段】分述私人轿车在五个城市使用比例的变化 【尾段】总述在澳大利亚私人轿车比公交更受欢迎
范文
The line graphs illustrate the changes of the percentage of the citizens using public transportation and using private cars in five different cities in Australia from 2000 to 2010. The percentage of those who use public transportation fluctuated in all cities during these ten years, among which the proportion of Sydney occupies the leading place. The second place and third place were owned by Perth and Adelaide respectively. The lowest percentage, which was around 5%, belonged to Melbourne. The percentage of those who chose the private cars outnumbered that of the citizens who used the public transportation. The ten years witnessed the gradual increase in all five cities, with Melbourne rising from 80% to 90%, making it the city where the private car was most popular. Although the citizens in the city of Sydney constituted the smallest proportion in private transportation, it still underwent an increase, from 20% to 25%. In summary, private transport was more welcomed in the five cities in Australia, with only a small proportion of people choosing public transportation.
- 03-27·2019年4月6日雅思写作小范围机经预测
- 03-25·2019年4月27日雅思写作机经预测
- 03-20·2019年4月25日雅思写作机经题目预测及范文
- 03-19·2019年4月13日雅思写作机经预测
- 03-18·2019年4月6日雅思写作小范围预测
- 12019-02-262019年3月9日雅思写作小范围预测
- 22019-02-122019年2月16日雅思写作机经预测
- 32019-01-262019年1月26日雅思写作小范围预测
- 42019-01-172019年1月19日雅思写作大范围预测
- 52019-01-172019年1月19日雅思写作小范围预测
编辑推荐
book.examw.com
-
 雅思9分之“听”为上策--新航道英语学习丛书¥39.00


- 模拟试题
- 历年真题